
Identifying Site Performance points:
We can verify the performance of the Sitecore site using OOTB admin pages, by changing some config changes, performance testing tools, etc.
Performance Data points:
The tools like JMeter can be used for concurrent log-in and performance testing.
Sitecore Admin Cache page:
Sitecore provides the OOTB cache page to verify the load/size of cache object and you can access it via URL HTTP://<HOST NAME>/Sitecore/admin/cache.aspx:

- On this page look for the following item’s that impact the performance of the Sitecore instance:

- This is useful to see the current in-use cache levels and the defined max value levels.
- If you’re performing a load test on the site, it's a good idea to check this page out to see what your usage levels are compared to your provided memory levels.
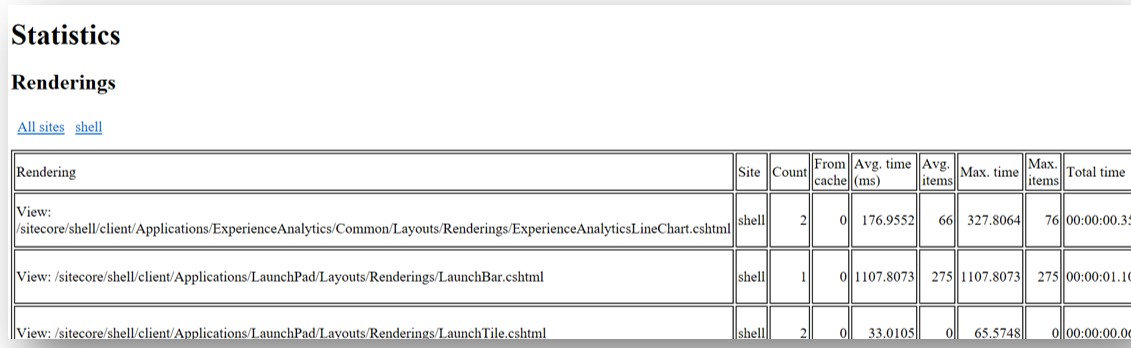
Sitecore Admin Statistics page:
The /Sitecore/admin/stats.aspx page is similar to the cache page as it shows what presentational components have been loaded for each site and how long they take to load.
It also identifies how many times these components have been loaded from the cache.
Sitecore Pipeline Profiler:
- The pipeline profiler allows the developers to check the number of executions, execution times, etc.
- Keep in mind that the Pipeline Profiling is not enabled by default and it needs to be enabled by renaming /App_Config/Environment/Sitecore.PipelineProfiling.config.disabled to /App_Config/Environment/Sitecore.PipelineProfiling.config.
- Set the value of the "Pipelines.Profiling.Enabled" setting to "true" if it is set to "false".
- There is also an option to measure the CPU usage of the pipelines by setting Pipelines.Profiling.MeasureCpuTime to true in the config file. By default, this file enables in Sitecore 9. x.
After that add the following key entry in the appSettings of your Web.Config:
<add key="env:define" value="Profiling" />

You can access the page using /sitecore/admin/pipelines.aspx.

Additional columns indicate:
• # Executions: The number of times that Sitecore has invoked the pipeline or individual processor.
You may see different numbers for different processors within a pipeline, as exiting a pipeline early can prevent Sitecore from invoking subsequent processors.
High values could indicate pipelines invoked excessively frequently.
High values could indicate pipelines invoked excessively frequently.
• % Wall Time: The percentage of the time elapsed during all invocations of a pipeline that elapsed during invocations of each individual processor.
Note that wall time does not necessarily indicate CPU time consumed by a specific process, but wall time trends can be indicative.
Relative values could indicate the most expensive processors in each pipeline.
• Wall Time: The number of milliseconds elapsed during all invocations of the pipeline
• Max Wall Time: The greatest amount of time elapsed during a single invocation of a pipeline or individual pipeline processor.
High values may indicate pipelines and processors that perform poorly under some conditions.
• % CPU (if the Pipelines.Profiling.MeasureCpuTime setting in the /App_Config/Environment/Sitecore.PipelineProfiling.config file is true): percentage of CPU time consumed by this processor during all invocations of this pipeline.
High values may indicate processors to optimize or CPU-bound processing conditions.
• Time / Execution: Average of wall time consumed by all invocations of a pipeline or individual processors.
High values may indicate inefficient pipelines or processors.
- The Event Queue Statistics queue provides an overview of Event Queue processing from the table in SQL Server.
- It includes details about the number of events in the table, the last processed timestamp, and the last timestamp.
- The tool is useful for verifying that cleanup tasks are running correctly so that large Event Queue does not cause performance issues.
- There is also a handy tool on the page allowing you to delete events older than a specified time period. You can access the page using /Sitecore/admin/EventQueueStats.aspx.

- A possible reason maybe the size of the Sitecore event queue.
SELECT count(*) FROM [EventQueue]
- If the count is high like 100K you need to clean up for better performance. Work best when less than a thousand records.
• Slow performance during publishing.
• Slow performance during indexing.
- Run the following query, replacing /* database name */ with the name of the database that the script runs against.
- Sitecore recommends that the number of rows (entries) in the EventQueue table be less than 1000. This prevents timeouts from occurring while the cleanup agents run.
Jobs Viewer:
- The Event Queue Statistics queue provides an overview of Event Queue processing from the table in SQL Server.
- The Jobs Viewer displays a list of jobs that are currently running, are queued to be run, or have recently run.
- This is useful to figure out “why is the system running slowly”, or “why has my publish been queued”.
You can access the page using /sitecore/admin/Jobs.aspx.

- The Event Queue Statistics queue provides an overview of Event Queue processing from the table in SQL Server.
- The Publish Queue Statistics Tool is similar to the Event Queue Statistics which was listed earlier and provides an overview of the Publish Queue table from SQL Server.
- The tool provides an overview of the last publish and the current number of changes that are in the publish queue table for that publish target.
Again, similar to Event Queue statistics, there is also a handy tool on the page allowing you to clean up the publish queue of entries older than a specified time period.
You can access the page using /sitecore/admin/PublishQueueStats.aspx.

Run below queries when:
• Slow performance during publishing.
• Slow performance during indexing.
- Run the following query, replacing /* database name */ with the name of the database that the script runs against.
- Sitecore recommends that the number of rows (entries) in the PublishQueue table be less than 1000. This prevents timeouts from occurring while the cleanup agents run.
- In the IIS user interface and in the application pool where the site is hosted, please check the currently running IIS worker Processes. Here we can see that each request is in a different part of the ASP.NET pipeline and currently executing HTTP modules.
- Now please check whether any requests are getting stuck at any stage. If there are multiple requests coming from the same URL are getting stuck then it means that some module in that URL is getting hung up or going into an infinite loop. Now we can investigate the modules used in this URL and find the actual issue.
A defined IIS application pool is what becomes a w3wp.exe process when the application starts up as an IIS worker process. They have two basic settings which are related to the version of .NET being used.
An IIS Worker Process (w3wp.exe) handles the web requests sent to the IIS web server for the configured IIS application pool.
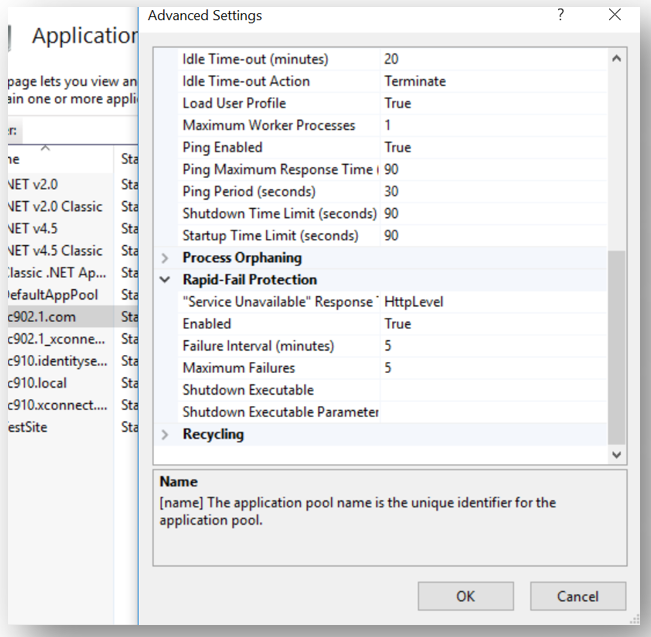
- Via the Windows Task Manager, you can see processes named w3wp.exe. Within the IIS management console, you can view more details. Open IIS manager and on the left side click on the name of your computer.
- You will then see a similar list of icons on the right as shown in the screenshot below. Double click on “Worker Processes” and you can get a list of which processes are currently running.

- On the Worker Processes screen, you can see more details than you would be able to see from Windows Task Manager. You can easily see the name of the IIS application pool and the Process Id for the running w3wp.exe process.
Not using A/B testing?:
- One of the things that I found in my instance while opening the pipelines page is that the Item Provider for A/B testing was slowing my instance down a lot. Since I knew I was not going to write A/B testing I commented it out.
- If you are not using A/B testing then you can disable this functionality. Open [WebRoot]/App_Config/Sitecore/ContentTesting/Sitecore.ContentTesting.config file.
<processor type="Sitecore.ContentTesting.Pipelines.ItemProvider.GetItem.GetItemUnderTestProcessor, Sitecore.ContentTesting" />
Or disable via Patch config:
Sitecore Performance Counters:
Counters store a piece of information about the number of different activities. They can be very useful but if you at a particular moment do not need them, you can just turn off them (a patch of course would be better).
<setting name="Counters.Enabled" value="false" />
Sitecore Page in Debug Mode:
With the help of Debug mode, we can identify the performance/load time of each rendering being added on the base.
• Select the item in Content Editor
• Open the item in Experience Editor
• Click on Home tab > Other option > Debug:

• With the help of the above data points, we can identify the renderings where code optimization needs to be done and caching needs to be enabled:

Credits/References:
- Sitecore Caching Fundamentals
- Caching Overview
- Sitecore CMS 7.0 - CMS Performance Tuning Guide
- Sitecore Experience Platform 8.2 – Performance White Paper
- Excessive load on ASP.NET Session State store
- Request Timed Out error details
- Sitecore Admin Pages
- Looking for ways to boost performance in your Sitecore instance? Check out these 3 tips!
- All about Sitecore performance counters — A real hero
- Publish Queue, History and Event Queue too big
- sitecore-event-queue-how-to-clean-it-and-why
- All About Jobs in the Sitecore ASP.NET CMS
- Icon designed by phatplus, mynamepong and Payungkead from Flaticon
Comments
Post a Comment